
OPERATIONAL
REPORTS
Structured reporting that turns daily operational data into clear, actionable information — so your team always knows what happened, what needs attention, and what to do next.
Get StartedWHAT YOU DON'T MEASURE
KEEPS COSTING YOU
Most operations run on gut feel, verbal updates, and end-of-day emails. Issues get missed. Patterns go unnoticed. The same problems repeat because no one has the data to see them coming.
Operational Reports give your team a structured, consistent view of what is happening in your business — every day, every shift, every issue — so you can manage with clarity instead of guesswork.
THREE REPORTS.
COMPLETE OPERATIONAL VISIBILITY.
Daily Operations Report
A structured daily snapshot of your operation — open issues, completed tasks, active alerts, team activity, and anything that needs attention before the next shift.
- Open issues by status and priority
- Tasks completed vs. assigned
- Active alerts and escalations
- Team activity summary
- Shift handoff notes
- Items requiring immediate action
Task Summary Report
A clear view of task performance across your team — who has what, what is overdue, what was completed on time, and where the bottlenecks are forming.
- Tasks by owner and status
- On-time vs. overdue completion rates
- Average time to close by task type
- Overdue task aging
- Workload distribution by team member
- Recurring task performance trends
Issue Tracking Report
A full audit of every issue logged — from detection to closure — with the data needed to identify patterns, repeat failures, and opportunities to prevent the next one.
- Issues by type, location, and severity
- Time from detection to assignment
- Time from assignment to closure
- Repeat issue identification
- Unverified or unclosed events
- Historical trend analysis
BUILT TO FIT
YOUR OPERATION
Filterable by Date, Team, or Asset
Slice the data the way your operation needs it — by shift, department, location, or asset.
Automated on a Schedule
Reports can run automatically — daily, weekly, or on demand — so the right people always have current data.
Role-Based Distribution
Send the right report to the right person. Operators see their tasks. Leadership sees the full picture.
Drill-Down Capability
Start with the summary, then drill into the specific event, asset, or team member behind the number.
Trend Visualization
See how your operation is improving — or where it is slipping — over days, weeks, and months.
Cross-Module Data
Reports pull from every module in your system — leaks, tasks, incidents, maintenance — into one unified view.
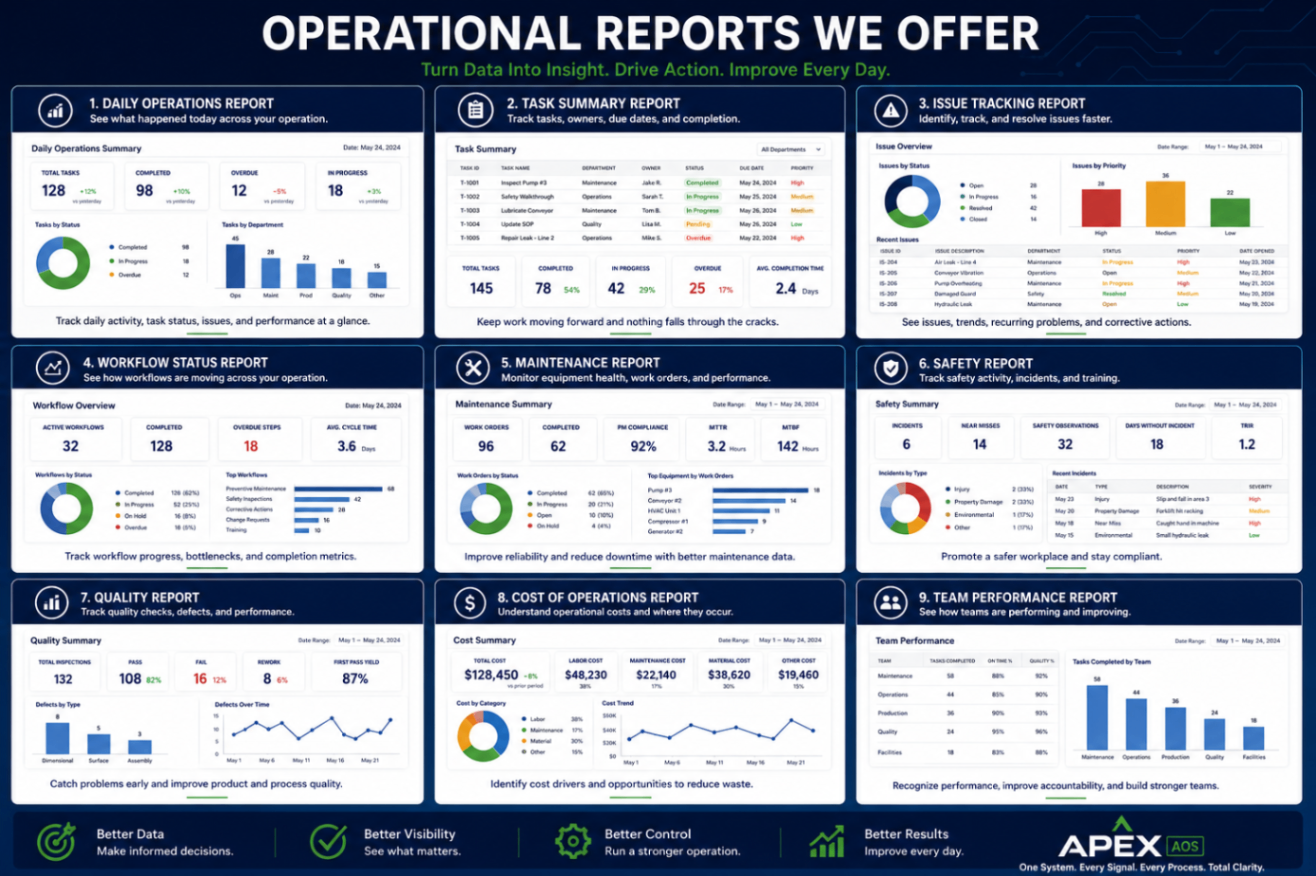
ALL 9 REPORTS
AT A GLANCE
STOP GUESSING.
START KNOWING.
Let's build a reporting system around your operation so your team always has the information they need to act fast and improve continuously.
Contact Us